Urgence gaz 0 800 028 800

Biomethane in your territories
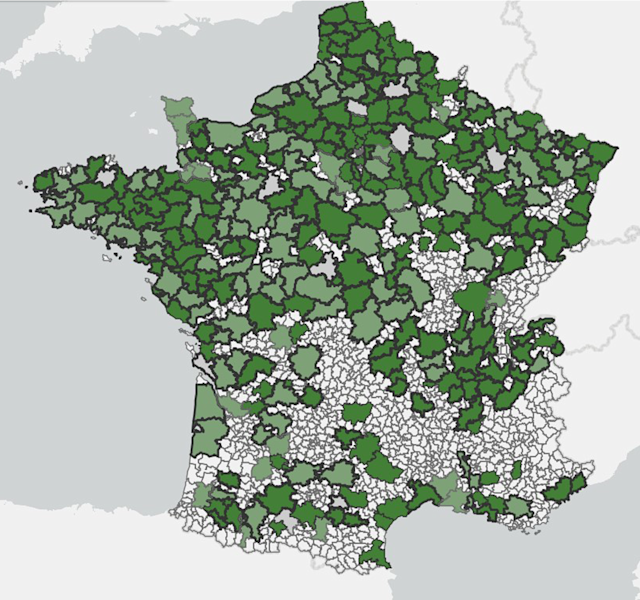
Do you want to inject biomethane produced in your facilities into the natural gas grids, or do you simply want to know the proportion of biomethane across the grids? We provide you with two maps. The first one will help you identify the most favourable areas for the injection of biomethane into the gas grids and thus confirm your choice of location. The second will allow you to follow the development of biomethane production in your territory.
The right to inject biomethane into the gas grid in France
The ‘right to injection’ decree and its implementation in deliberation No. 2019-242of the Energy Regulation Commission (CRE) govern the biomethane insertion into gas grids. Grid operators must work together to define the optimum connection scheme for injection projects in the same area. The aim is to minimise the costs of grid adaptation borne by the community.
These grid adaptation costs can be borne by the operators, according to the technical and economic criteria defined by the ‘injection rights’ decree.
Mapping grid access for biomethane producers
For information purposes only, we are providing you with a map of grid access conditions for biomethane producers.
You will find a first order of magnitude of the technical and economic criterion: the lower the value of this criterion, the better the possibilities for grid operators to carry out reinforcements to accommodate biomethane in the area.
To view the map in full screen, click here.

Teréga supports your biomethane injection project
Please note that, even in a favourable area, only a feasibility study can provide a precise definition of the technical and economic conditions of a possible outlet for your biomethane project.
Teréga will help you make your biomethane project a reality, from the study phase to the work itself.
Follow the development of biomethane production in your territory
Using the monthly calculations from the renewable gases indicator (IGR), you can follow the development of biomethane production in the networks across your territory. This indicator shows the ratio of locally produced biomethane to gas consumption over a specific period of time within a specific territory.
Using the map, you can therefore track the IGR month by month, within different geographic perimeters at departmental level. You can also compare the monthly IGR in the Teréga area over 4 years, between 2021 and 2024 using the bar chart we have set up.


